Managing Multiple Servers with Tailscale
I currently operate two servers: my homelab at home and a VM hosted by a friend in Chicago. The VM runs a tool I made in college called Skyviewer, which allows you to search for LEO satellites, as well as a modded Minecraft server. On my homelab, I host quality of life services like a DNS blocker, a link manager, and more. Previously, these two machines operated separately. They each had their own instance of Grafana and Portainer, and would access each other over the internet. For centralized metrics and security, this was a nightmare. I needed a simple way for both machines to communicate with each other and share data. The best way to connect the two machines directly is through a VPN. In fact, I already had Tailscale set up on my homelab, which provided me a secure and direct path to my homelab while I was outside my local network. Due to this, it was relatively easy to add the VM to the tailnet to create a secure connection between the two machines. This let me centralize all my metrics onto the Grafana instance I set up in my final homelab adventures post.
The first thing I needed to do was make sure each machine has an instance of Tailscale installed. The homelab did, but the VM did not. Tailscale has great documentation on how to install it on any machine, so I won’t delve into it here. After installing Tailscale on the VM, both machines were able to access each other with their Tailscale IP addresses. When setting this up yourself, you can confirm this by trying ping <other-tailscale-ip> from each machine.
After confirming that the machines can communicate with Tailscale, it was time to set up the exporters on the VM. There were three things I really wanted to measure - the performance of my Minecraft server, the performance of Skyviewer, and the performance of the VM itself. For the Minecraft server, I decided to go with mc-monitor. This is a simple exporter that exposes metrics about the Minecraft server. It pairs great with docker-minecraft-server by itzg, which I highly recommend for running a Minecraft server. You can link it to a modpack on CurseForge and it will automatically update the server for you.
To track some basic traffic metrics about Skyviewer, I used nginx-prometheus-exporter. This one is less plug-and-play than the others. To make it work, you need to make sure you expose the stub status page for the exporter to scrape. To do this, you need to make sure you have the HttpStubStatusModule. After you do that, you can add another site in the sites-enabled directory of nginx with the following configuration:
server {
    listen 127.0.0.1:7080;

    server_name _;

    location /status{
        stub_status;
    }
}
There is no reason to have this exposed globally, which is why I only listen on localhost. If you do curl http://localhost:7080/status on the VM, you should see the metrics from the stub status page. Now, you can have the nginx-prometheus-exporter scrape this endpoint and expose it to Prometheus.
As a note for nginx-prometheus-exporter, if the exporter is containerized and nginx is on the main machine, keep in mind that localhost will refer to the container itself, and thus not access the stub_status page. To get around this, you can add host.docker.internal:host-gateway under extra_hosts, and then have the exporter scrape http://host.docker.internal:7080/status.
Finally, for the VM resources itself, I used node exporter. I touched on node exporter in “Homelab Adventures Part 4”, but it is a simple exporter that exposes metrics about the machine itself, like CPU usage, memory usage, disk usage, etc.
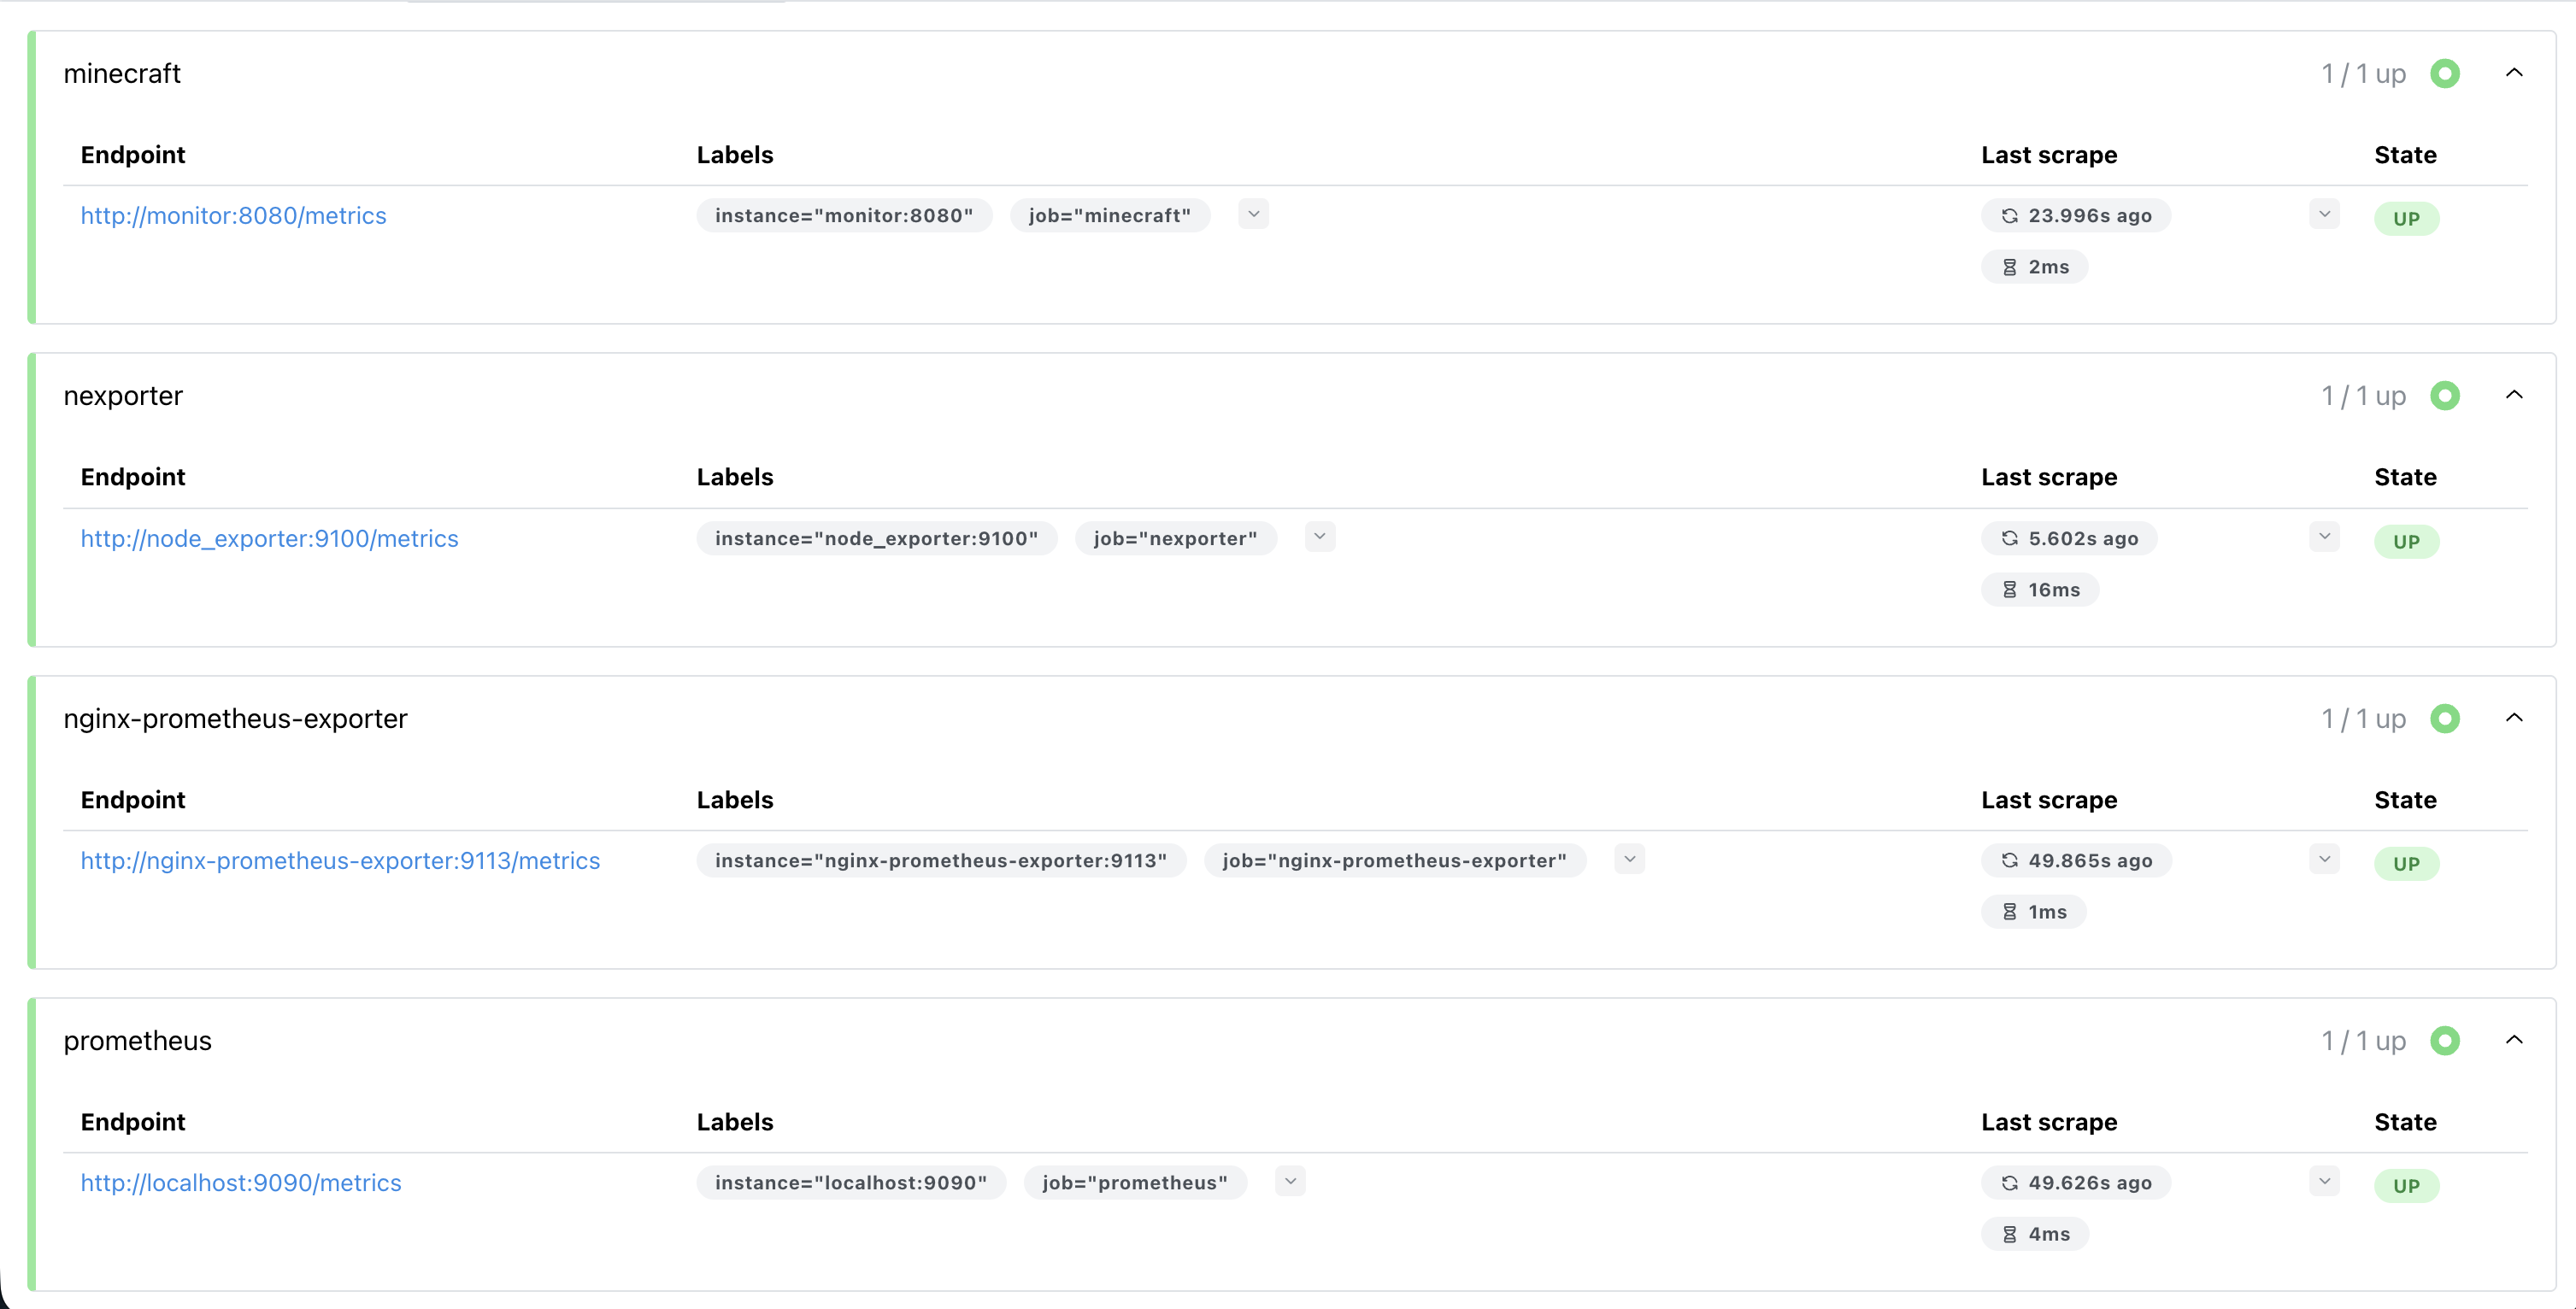
Now that I had all the exporters and Prometheus set up on the VM, all I had to do was add it as a data source in Grafana on the homelab. I could do this with <tailscale_ip>:9090, where in my case 9090 is the Prometheus port. After that, I needed to do a bit of cleanup. I shut down the portainer instance on the VM and add a new environment to the portainer instance on my homelab. This would allow me to spin containers up and down on the VM and homelab in one place, and it ended up being pretty simple. You can use something called portainer agent. I spun up an instance of it on the VM using the following compose file:
services:
    portainer_agent:
        image: portainer/agent:latest
        container_name: portainer_agent
        restart: always
        ports:
            - 9001:9001
        volumes:
            - /var/run/docker.sock:/var/run/docker.sock
            - /var/lib/docker/volumes:/var/lib/docker/volumes
Then, you can go into portainer on the homelab, add a new environment, and select “Agent”. For the URL, you can use the Tailscale IP of the VM and the port you exposed for the agent, 9001 by default. And that’s it!
In Grafana, you should be able to add the Prometheus instance on the VM as a new data source through its Tailscale IP and the port it uses. Now, I have saved resources by removing unnecessary containers, and I have improved security by communicating over a VPN instead of the broader internet. I am much happier with this new configuration.
One final thing I did was ensure that Prometheus on the VM was only accessible over the Tailscale network. To do this, I modified the ports line in the Prometheus compose file to only listen on the Tailscale IP, like so:
ports:
    - <tailscale_vm_ip>:9090:9090
This bound it to Tailscale and ensured that it was not accessible outside of the VPN. This is a good security practice, especially for something like Prometheus, which does not have built in authentication.


Leave a comment